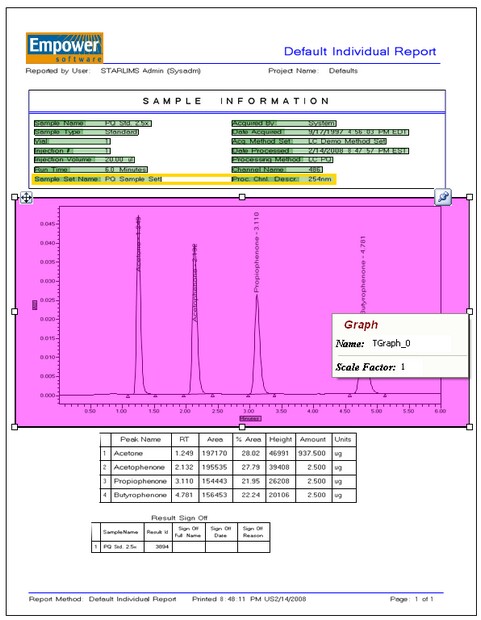
![]() Images are automatically recognized by SDMS and can be encoded inside XML as PNG files. It is also possible to add images manually using the Graph option. Painting a graph area allows the user to capture an image into the output bitmap. You can right-click on the graph selected and specify its Scale Factor, that is the relative size of the graph to be displayed in the template.
Images are automatically recognized by SDMS and can be encoded inside XML as PNG files. It is also possible to add images manually using the Graph option. Painting a graph area allows the user to capture an image into the output bitmap. You can right-click on the graph selected and specify its Scale Factor, that is the relative size of the graph to be displayed in the template.
The Graph tool allows you to define an area on the image that will include not only the image but also text and other properties. This is very useful for reports, as the whole selected area will be exported as an image file that can be used in any external application such as STARLIMS.
In order to add a graph, click on the Graph button in the Toolbox, and paint the area in the document where the graph is located. In order for the system to identify the graph, an anchor needs to be defined above the graph. An anchor can be added either from the toolbox or created automatically by the system. The system will choose the nearest keyword and identify it as an anchor.
To view and edit the graph properties, select the graph and click on the Properties tab in the right pane. When right-clicking the graph, you can edit some additional properties, such as the Scale Factor which is the size of the graph as it is displayed in the output XML. You can set the graph size to be larger and in higher resolution or smaller than the original size. For example, setting the Scale Factor to 3 produces a graph that is three times larger than the original, while setting Scale Factor to 0.3 produces a graph that is about one third of the original size. Leaving the default value as 1 produces a graph that is in the same size as the original graph.
To use the Graph option, you should first use the Anchor tool to define anchors for the value, and only then mark the appropriate graph. If no anchors exist on the same page, the system will try to create one automatically, by creating an anchor over other objects like Keywords and Tables. If the process fails, the graph will not be created.