![]() The following section describes the SDMS Logs tracing tool. The Logs window allows a user search and view various logged actions such as system, project, file type, DRP, Unified XML, and so on. The SDMS Logs window allows narrowing down searches by selecting different conditions such as date, users, Object ID, and so on.
The following section describes the SDMS Logs tracing tool. The Logs window allows a user search and view various logged actions such as system, project, file type, DRP, Unified XML, and so on. The SDMS Logs window allows narrowing down searches by selecting different conditions such as date, users, Object ID, and so on.
>> To trace SDMS Logs
| 1. | Log on as a user with role access to Utilities > SDMS Admin and open that branch. |
| 2. | Click on the Logs tab; the Logs window appears. |
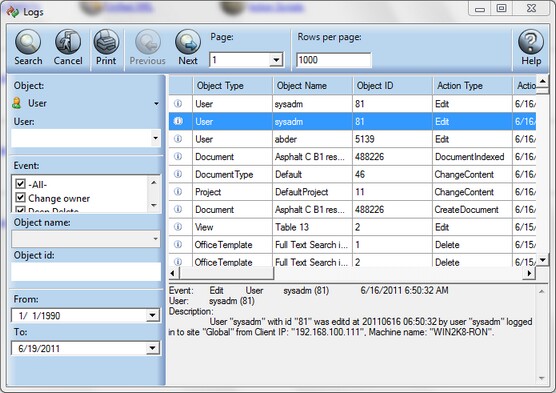
| • | You can sort logs by various system entities such as: |
| • | Object - Select the relevant object from the Object drop-down list. |
| • | User - Select the relevant user from the User drop-down list. |
| • | Event - Relate events to the selected object by marking the options in the Event field. |
| • | Object ID - Type the unique identifier in the Object ID field. |
| • | Date - Set the dates in the From and To fields. |
| 3. | Click on the Search button to apply your selections. |
| • | You can navigate between different search criteria by clicking Next or Previous. |
| • | You can easily navigate between different log pages as well as define how many entries will appear per page (default is set to 1000). |
| • | When highlighting a line, the log description will appear on the bottom field. |
![]() TIP You can print logs by clicking the Print button and selecting printer or Print to file option.
TIP You can print logs by clicking the Print button and selecting printer or Print to file option.
![]() IMPORTANT To view system information and fatal error logs you need access to the SDMS Web server in order to open WarnErrorFatal.html and Info.html web pages. These logs are located under the SDMS installation directory ~\Site\LogFiles.
IMPORTANT To view system information and fatal error logs you need access to the SDMS Web server in order to open WarnErrorFatal.html and Info.html web pages. These logs are located under the SDMS installation directory ~\Site\LogFiles.