![]() The Grabbers Monitor application lets a user with the appropriate privileges to remotely control the currently active Grabbers, installed and deployed by different users. The component supplies information about each Grabber's configuration (instruments and folders) and can be used to control their state: you can send commands to the Grabber itself, such as "Pause/Continue Grabbing" or to its connected instruments, such as "Stop/Start/Restart/Clear Queue" and so on. The user can also view activity statistics of each Grabber. For more information about the Grabber application, see section SDMS Grabber.
The Grabbers Monitor application lets a user with the appropriate privileges to remotely control the currently active Grabbers, installed and deployed by different users. The component supplies information about each Grabber's configuration (instruments and folders) and can be used to control their state: you can send commands to the Grabber itself, such as "Pause/Continue Grabbing" or to its connected instruments, such as "Stop/Start/Restart/Clear Queue" and so on. The user can also view activity statistics of each Grabber. For more information about the Grabber application, see section SDMS Grabber.
>> To monitor Grabbers
| 1. | Log on as a user with role access to Utilities > SDMS Admin and open that branch. |
| 2. | Click on the Grabbers Monitor tab; the Grabbers Monitor window appears. |
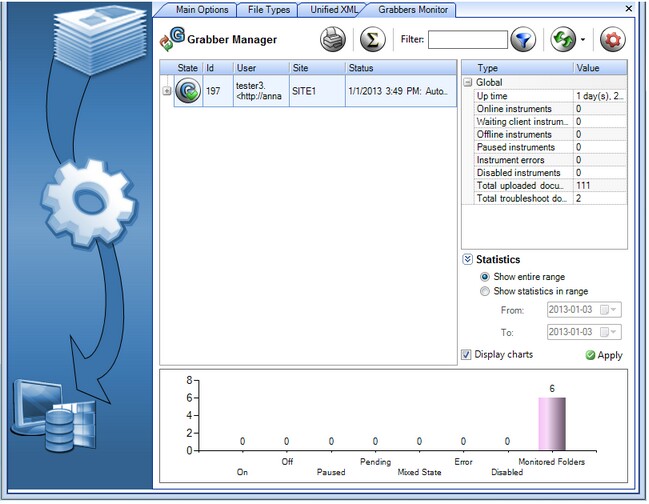
| 3. | The window displays the users who have Grabbers connected to their computers. To view Grabbers configured per user, select the relevant user entry from the list. For detailed explanation about these information rows, see section Viewing Instrument Statuses. |
| 4. | To view configuration settings for a Grabber, select the relevant Grabber entry relating to the specific user, and then press the Settings button. The Service Configuration dialog box appears, displaying this Grabber's configuration settings. For more information about this window, see section Configuring Grabber Service. |
| 5. | To control the state of a specific Grabber, select it from the list, and then press the Connection button. From the pop-up menu, select the relevant command such as "Pause" or "Continue Grabbing". |
![]() NOTE These commands can be performed also from within the Grabber application. For more information about these commands, see section Using SDMS Grabber.
NOTE These commands can be performed also from within the Grabber application. For more information about these commands, see section Using SDMS Grabber.
| 6. | To view the statistics pertaining to each Grabber, select it from the list, and then press the Statistics button. The pop-up menu displays information on the Grabber's activity - how many files have been sent/received, or how many errors occurred during the connection. |
![]() NOTE You can also view statistics pertaining to a specific user, in which case the pop-up menu will show you the number of instruments connected and total count of the messages and grabbed documents for that user.
NOTE You can also view statistics pertaining to a specific user, in which case the pop-up menu will show you the number of instruments connected and total count of the messages and grabbed documents for that user.
| 7. | If necessary, you can filter the statistics by date range using the Show statistics in range option, and then selecting the relevant dates from the From and To drop-down lists. Note that you can choose how long you want to keep the statistics data by selecting the relevant option from the Keep statistics for drop-down list. |
| 8. | When viewing statistics, you can mark the Display charts check box to see these statistics in form of a graph. Note that the graph components differ according to the entity for which you are viewing the statistics - a Grabber, or an Instrument, connected to the selected Grabber. When the user selects a Grabber row, the graph shows information about the current state of the grabber (how many instruments are on, off and so on); when the user selects an Instrument row, it shows information about the instrument activity. |
| 9. | For a connected instrument, you can also view the history log, which contains details of the instrument's connection activity to the system. To do so, right-click the relevant instrument, and select the Log option from the pop-up menu; the History Log dialog box appears, containing all the instrument's logging data. |