![]() The Status window allows you to view information about all the folders and instruments connected to your Grabber, and the statuses of their connection with the system. Instead of looking at each folder or instrument individually using the Grabber activities menu, use the Status window to see all the grabber-monitored folders and connected instruments in one frame. The Status window can also be used to control instrument state: you can send commands to the Grabber itself, such as "Pause/Continue Grabbing" or to its connected instruments, such as "Stop/Start/Restart/Clear Queue". It also contains logs documenting the Grabber's activity, and technical information about the Grabber service, such as version number and build date. The Status window's functionality is very close to that of the Grabber Monitor window, with the exception that Grabber Monitor displays for a user with administrator privileges all the connected users and their Grabbers according to the administrator's site, while the Status window shows all the information relating to a single user's Grabber and is evoked locally, from this user's computer. For more information about Grabber Monitor, see section Grabbers Monitor.
The Status window allows you to view information about all the folders and instruments connected to your Grabber, and the statuses of their connection with the system. Instead of looking at each folder or instrument individually using the Grabber activities menu, use the Status window to see all the grabber-monitored folders and connected instruments in one frame. The Status window can also be used to control instrument state: you can send commands to the Grabber itself, such as "Pause/Continue Grabbing" or to its connected instruments, such as "Stop/Start/Restart/Clear Queue". It also contains logs documenting the Grabber's activity, and technical information about the Grabber service, such as version number and build date. The Status window's functionality is very close to that of the Grabber Monitor window, with the exception that Grabber Monitor displays for a user with administrator privileges all the connected users and their Grabbers according to the administrator's site, while the Status window shows all the information relating to a single user's Grabber and is evoked locally, from this user's computer. For more information about Grabber Monitor, see section Grabbers Monitor.
>> To view statuses of folders and instruments monitored by Grabber
| 1. | Start the SDMS Grabber and log on, as described in section Starting Grabber. |
| 2. | Double click the Grabber icon; the Status window is displayed. The window contains three tabs, dividing the information it contains into the following sub-sections: |
| • | The Status tab - contains information about facilities connected to the Grabber. |
| • | The Activity tab - contains logs, documenting the Grabber's connection activity. |
| • | The About tab - contains technical information about the installed version of your application. |
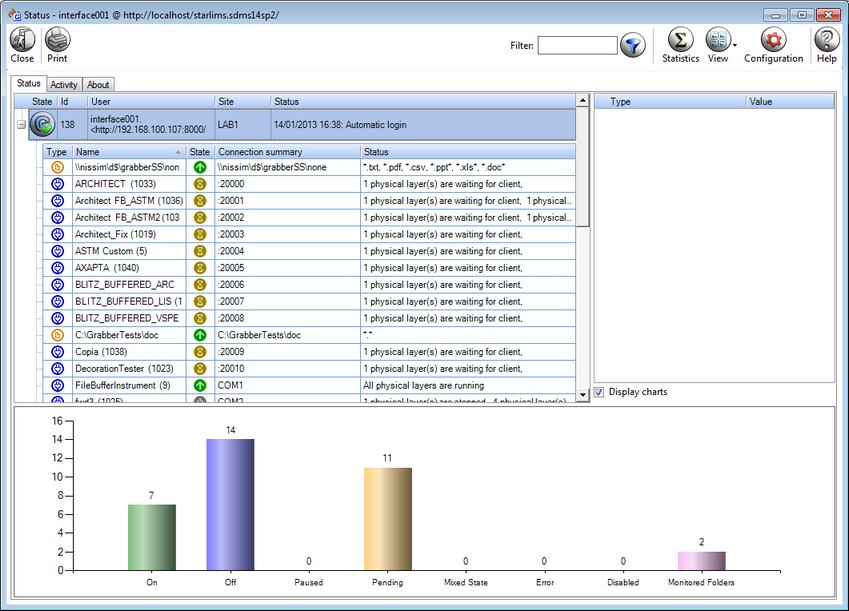
| 3. | Click the Status tab to view information about your Grabber-user details, the folders that your Grabber monitors, and connected instruments. The upper information row displays the following Grabber user details: |
| • | The State column - indicates the state of your Grabber connection. The following states can appear: |
Button Name |
Icon
|
Description |
Connected |
|
The Grabber is connected to the system and is ready to grab files.
|
Paused |
|
The Grabber is connected but the service is paused, so it is not grabbing files at the moment.
|
Pending |
|
The Grabber is pending to be connected to the system, after the connection was initiated.
|
Off |
|
The Grabber is disconnected from the system.
|
Error |
|
Errors occurred while trying to connect to SDMS (connection failed). |
| • | The ID column - your user ID number, generated by the system. |
| • | The User column - your username, and your SDMS logged-in site address. |
| • | The Site column - the STARLIMS site that your user belongs to. For more information about sites, read the STARLIMS User Guide. |
| • | The Status column - the date and time of your logging into the Grabber, as well as the type of your user login. Note that the login type is defined using Service Configuration window. For more information about this window, see section Configuring Grabber Service. |
| 4. | You can manage your Grabber activities from the Status window. Right click the user-information row to perform the one of the following actions: |
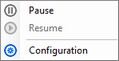
| • | Pause - select this option to pause the Grabber's activities. |
| • | Resume - select this option to resume the Grabber's activities. |
| • | Configuration - select this option to view the Grabber configuration settings. For information about this window, see section Configuring SDMS Grabber Settings. |
| 5. | Click the Expand button |
| • | The Type column - the type of the Grabber monitored facility, namely, a folder |
| • | The Name column - the name of the connected facility, as defined in the configuration settings, while connecting it to the Grabber. For more information, see section Configuring SDMS Grabber Settings. |
| • | The State column - the connection state of the facility monitored by Grabber. The following states can appear: |
For a monitored folder:
Button Name |
Icon |
Description
|
Watch |
|
The folder is being watched (monitored) by Grabber for newly created documents.
|
Pause |
|
While the monitored folder is in the paused state, new files won't be grabbed until the user resumes the operation, then the service will synchronize them.
|
Error |
|
There are errors in the folder's definitions, so that the Grabber is unable to grab the folder's documents.
|
For a connected instrument:
Button Name |
Icon |
Description
|
On |
|
The instrument is turned on and is connected to the Grabber.
|
Off |
|
The instrument is turned off, even though it is connected to the Grabber.
|
Paused |
|
The instrument connection to the Grabber is paused.
|
Pending |
|
The system is waiting for the Client to connect.
|
Errors |
|
There were errors during the instrument connection and the system was unable to connect with the instrument.
|
Disabled |
|
The connection with this instrument has been blocked from the Server side.
|
Mixed |
|
There are differences between the states of the instrument's physical layers. For information about multiple physical layers defined for one instrument, see section Designing the Protocol Physical Layer.
|
Warning |
|
There is a warning sent from the server regarding this instrument's connection. |
![]() NOTE The View button allows you to alternate between small and large icons, representing the Grabber states and types. The above icons are large icons. However, in the screen capture of the Status window above, you can see small icons.
NOTE The View button allows you to alternate between small and large icons, representing the Grabber states and types. The above icons are large icons. However, in the screen capture of the Status window above, you can see small icons.
| • | The Status column - contains details about the connection of the facility to the system. |
| 6. | You can manage the activities of a connected instrument from the Status window. Right click the relevant instrument row to display the available actions to perform on that instrument in a pop-up menu. For more information about these actions, see section Managing Instruments. |
| 7. | Click the relevant information row and then click the Statistics button to display the statistics summing up the activities of a selected object (click your user row if you want to view statistics of all your connected instruments and monitored folders, or a folder/instrument row to see the statistics pertaining only to the selected facility). For more information, see section Grabbers Monitor. |
| 8. | Click the relevant facility row and then click the Configuration button to display the configuration settings used for the connected facility. For more information, see section Configuring SDMS Grabber Settings. |
| 9. | Click the Activity tab to display the logs reflecting your Grabber activities. To display the technical information about the Grabber version that you are using, click the About tab: the technical information includes the version number, the build date, the DLLs used by the service and by the manager, and the date the application was compiled. When finished, click Close. |